Science of Frontline Workforce Performance
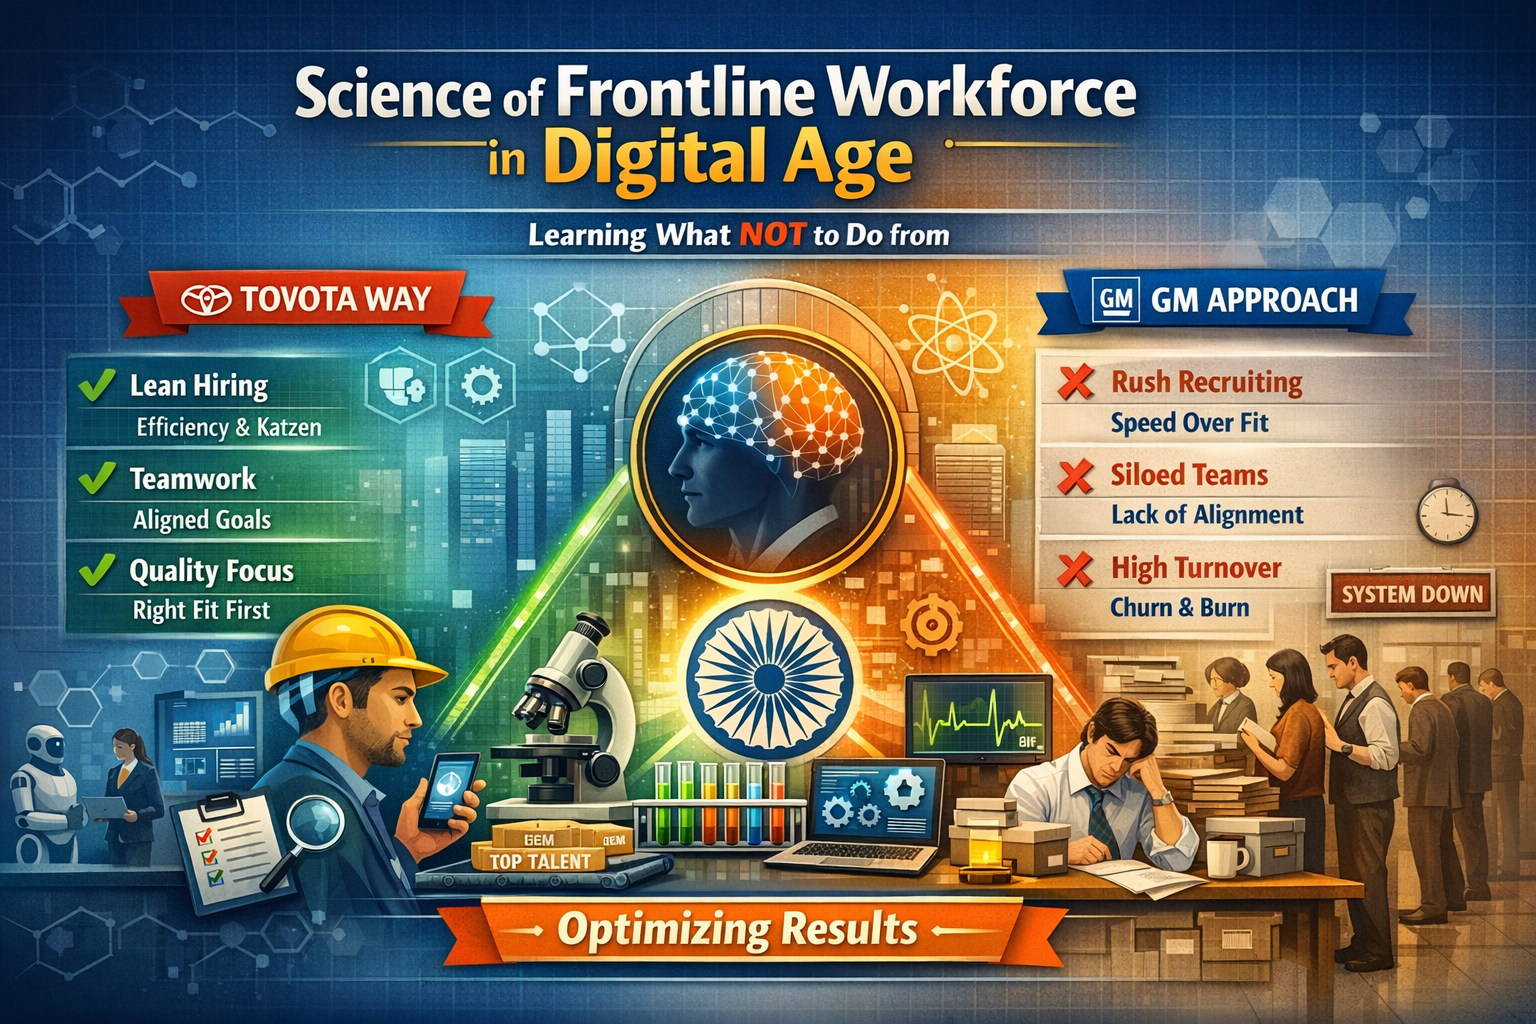
Reversing the Tide of High Attrition and Low Productivity
- 1. Cost of back fill due to infant attrition ONLY due to under-performance may be up to 4 months’ salary.
- 2. Bottom 10% of the performers are performing 1/8th of Top 10% performers, even after moderating over time, but earn the same fixed salary. The huge performance variation is hidden by the average productivity.
- 3. Up to 30% of HR budget is wasted due to under-performances. 30% to 40% higher sales can be achieved with the same sales team.
There are severe consequences – High Operating Costs, Low Business Continuity, Stagnant and Low Compensation to attract better frontline talent. We are in a negative cycle of lower productivity and higher attrition – due to poor talent induction.
Can we reverse this into a positive re-enforcement cycle? If yes, how do we do it? These are the questions we want to address. Before we venture further, we want to ask a simple question – Why have we not been able to solve these problems despite best efforts in the last two decades by hundreds of employers, across several industries?
Failing “to see the real picture” of how performance happens on the ground.
- 1. Interestingly, 15% to 20% of the employees in a cohort are super performers and they start performing very early. About 40% to 50% of the employees are poor performers. The focus till date has been on the poor performers and how to improve them. But we have failed to focus on the super performers. They are in the same group, hired and inducted the same way, face the same operating environment, face the same market conditions, and still perform. What is the secret of their success? We have failed to learn from them.
- 2. We use a wrong framework to measure, rank, analyse and reward people performance. We use performance outcomes as the primary metric – which are lag indicators instead of using lead indicators of performance. We use calendar-month performance indicators instead of residency-month performance indicators.
- 3. We do not have an effective framework to connect hiring, induction training, and skilling to “on-the-job” performance.
- 4. We wrongly assume that performance must be extracted by the supervisor because the FE is lazy and does not want to put in the adequate effort. This has put enormous stress on the supervisor who passes on the same to his new direct reportees resulting in infant attrition. We have failed to realize that every new employee wants to win on the job, on day #1. We have failed in architecting a “winning” environment for the frontline.
In short, the Performance Management System(PMS) we are using is built on wrong foundations, wrong assumptions and we have “failed to see the real picture” on how performance happens on the ground. We have failed to listen to data and instead pursued same-old theories.
How do we reverse the cycle?
- First recognise that performance acceleration is a scientific step-by-step incremental “drip” process.
- Second, we must architect and re-engineer the performance management system, by looking for scientific “cause and effect” and direct relationship between effort and outcome. This will help us in identifying the levers that we must press to get performance outcomes. These are called Lead Indicators of Performance (LIPs). LIPs are determined by using a new scientific Role Modelling Framework.
- Third, we must recognise that performance acceleration is an integrated system with several components like Hiring Right, Inducting Right, Measuring Right, Supervising Right, Rewarding Right etc. This integrated system must be optimised as a whole and cannot at component level, as we are doing right now.
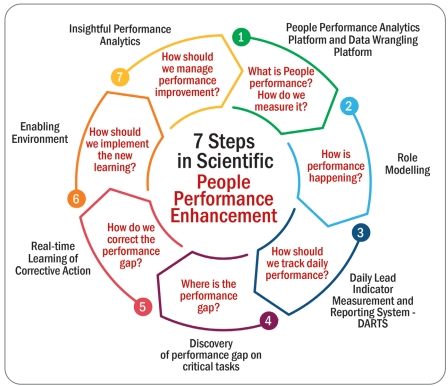
Step-by-step integrated process for performance acceleration
Step 1: Adopt a new People Performance Analytics Framework (PPAF). Why? There are five reasons:
- 1. PPAF recommends the use of CAP or Cumulative Average Performance over an optimal residency period as the key metric for PMS. This metric moderates performance over a period and enables comparison of people with the same Vintage/Residency.
- 2. PPAF generates deep insights on how performance really happens on the ground. It generates answers to more than 50 critical questions like What kind of people to hire? Will attrition automatically drop if FE performance goes beyond a threshold? When should the employer send a FE for PIP (Performance Improvement Program) and When should I ask the FE to leave? Is the incentive scheme working? Which FEs stay and Perform? Which supervisors achieve both retention and performance of FEs? Is the compensation structure supporting high performance? PPAF has identified over 13 Blind spots in the current PMS for frontline.
- 3. One of the key insights from the new PPAF is that infant attrition and low performance are positively correlated. Attrition of employees drops dramatically once performance crosses a threshold value. This clearly means that the real problem is performance acceleration viz slow and low performance, of new entrants into the role.
- 4. Another key insight from the new PPAF is that average performance metric hides a huge distribution of performance within a cohort. 20% of the performers are super performers while 40% to 50% are very poor performers but the average hides this reality.
- 5. The new PPAF drilldown and multi-dimensional analytics helps in segmenting the employees and supervisors into multiple sub-segments for custom interventions.
Step 2: Adopt Role Performance Modelling Framework (RMF). Why? There are six reasons:
- 1. Study of top performers reveal only two things that separate them from bottom performers. First, they prioritise their time, daily, for a few critical tasks. Second, they execute these critical tasks differently and quickly achieve Role Mastery by achieving mastery of these critical tasks. Interestingly critical tasks constitute only 20% of all the tasks in the role.
- 2. RMF establishes the scientific correlation between effort (Cause) and outcome (Effect) by adopting the Activity Based Costing Model
- 3. RMF establishes a new layer in-between effort and outcome viz daily outputs.
- 4. RMF identifies the critical tasks in every role and identifies the output metrics of these critical tasks, which are the Lead Indicators of Performance (LIPs).
- 5. RMF helps in aligning Role induction training to the critical task mastery.
- 6. LIPs help in correcting the performance in the current performance cycle unlike current lag indicators.
Step 3: Encourage the FE to participate and own the immediate performance improvement, by self-selecting the improvement goal. Why? These are the three reasons:
- 1. Motivation to improve is the pre-requisite for performance improvement.
- 2. Motivation comes by connecting effort to personal benefits like incentives and recognition.
- 3. Achievability and self-belief (“I can do it”) is a pre-requisite to motivation. Self-selecting the improvement goal based on past data and data of peers instils self-belief.
Step 4: Identify the largest performance gap on LIPs to initiate corrective action, immediately. Why? These are the three reasons:
- 1. Outcome Performance gap is the gap between the current FE performance and his/her self-selected outcome goal.
- 2. Since LIPs are directly correlated with performance outcome, performance gap in LIPs are directly correlated with performance gap in outcomes.
- 3. Every individual performs well in some LIPs and poorly in some. LIPs where FE performance gap is the highest is the first action point to reduce the outcome performance gap.
Step 5: Provide customised action plan for each employee. Why? These are the three reasons:
- 1. Each employee is on a unique performance journey and selects a different outcome goal.
- 2. Hence largest performance gap will be different for each employee and will change with time. Hence the corrective action will also be different.
- 3. The corrective action is the learning path.
Step 6: Give an implementable micro learning path to reduce the performance gap. Why? These are the four reasons:
- 1. Each corrective action is linked to a critical task.
- 2. A Secret of Success (SoS) video is linked to each critical task.
- 3. This SoS micro video is made by a peer who is currently implementing the SoS, and it shows how to execute the critical task.
- 4. The SoS video is fully implementable because it is working on the ground.
Step 7: Involve the supervisor to become the motivator and guide on the customised action plan. Why? These are the three reasons:
- 1. Supervisor can now give an actionable answer the simple question of the low performer – “Tell me what I should do, to improve performance – today?”
- 2. Supervisor can reinforce the learning path and implement to corrective action identified in Step 5
- 3. Supervisor can track the implementation and provide real-time feedback.
Step 8: Create new performance metric for the supervisor to focus on new entrants and low and medium performers. Why? These are the three reasons:
- 1. Supervisors tend to focus and flog the high performers and ignore the low and slow performers who need their attention and support.
- 2. A new performance metric for supervisor is required to change supervisor’s behaviour.
- 3. The New Metric – reduction of Performance Multiple between the top and bottom performer- will force the Supervisor to focus on new entrants and low performers.
Step 9: Track the LIPs to set up a positive reinforcement cycle. Why? These are the four reasons:
- 1. Implementation of the SoS leads to improvement in LIPs connected with the Critical task.
- 2. Motivation is directly linked to LIPs improvement and thereby the performance outcomes.
- 3. Positive feedback based on improvement in LIPs sets up the positive reinforcement cycle.
- 4. Tracking of LIPs daily helps in providing real-time feedback. If LIPs improvement is absent, then the supervisor is notified and encouraged to discuss with the FE.
Science of Performance Acceleration – Summary
- Measure LIPs daily
- Identify performance gap to be reduced – today
- Watch a micro SoS video to reduce the performance gap
- Commit to Implement the SoS video
- Track if the implementation is happening. If yes, supervisor to give positive feedback and encourage him to do more. If not ask the supervisor to motivate him to implement the learning
- All the above steps happen – every day
- All the given steps are customised for each person – based on his/her performance gap, every day
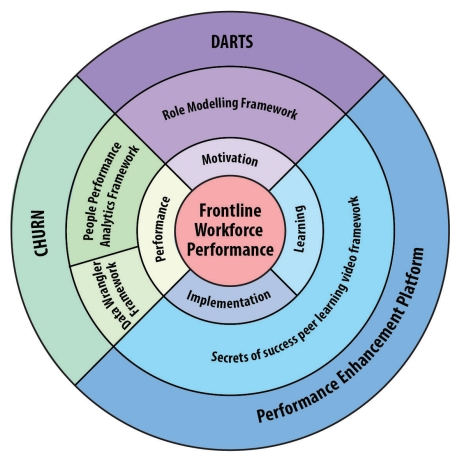
CLAN Solution
- India’s first integrated platform – DARTS, CHURN and CLAN PEP – for increasing productivity and reducing infant attrition of Frontline workforce.
- Clan adopts three new frameworks – People Performance Analytics Framework (PPAF), Role Modelling Framework (RMF) and Secrets of Success Video Framework (SVF)
- Clan makes the supervisor more effective to work with low and slow performers
- Clan uses a “Drip” scientific model for creating a positive reinforcement cycle.
Centre of Excellence for Frontline WorkForce Performance (COE-FWP)
COE-FWP was set up by TMI Group (www.tmigroup.in) to help organizations solve the twin problems of low productivity and high infant attrition of frontline workforce in sales, customer service, or operations by leveraging the power of AI, Analytics and Digital Technology.
COE-FWP has discovered that the high attrition and low productivity problem is solvable and the seeds of the solution is already within the same organisation. For every 5 under performers, there is already 1 super performer who is staying and performing. The solution is, discover the secrets of the success of performers and transfer it to others.
COE-FWP conducts free webinars and in-house presentations on its research findings. COE-FWP also conducts customised People Performance Analytics for interested organisations.
For more details, please contact:
Ms. Bindu
+91 98851 11885
himabindu@tminetwork.com
tmigroup.in/center-of-excellence-ppm