Should Real Wages of Workers Go Upin Indian Manufacturing?

Should Real Wages of Workers Go Up in Indian Manufacturing?
1. Introduction
India as an economy appears to have evolved from an agriculture-based economy to a service-based economy, discernibly deviating from the conventional wisdom of agriculture being the major source of growth during the first phase, then manufacturing being the principle source, and finally the major share emanating from the services sector.
While some of the prominent economies had the predicted structural transformation of economic growth, conforming to the conventional pattern of agriculture-led to manufacturing-led and then to service-led growth, in India, during 1991–2011, the share of manufacturing in net domestic product hovered around 13% to 15%, showing no discernible contribution of manufacturing to the ongoing structural changes in the economy. Moreover, the share of the manufacturing sector in employment during the same period hovered around 11%.
Recent policy discussions, drawing cues from discourses in forums such as legislative bodies, industrial associations, media, scholarly writings, and so on, point to the current state of the Indian economy’s passive response to growing opportunities in global manufacturing in terms of employment, research and development, and innovation. Although during last two decades some Indian firms emerged to the global leadership in manufacturing, the real potential seems to have been largely unexplored.
While informal low-wage employment is showing growth in manufacturing, formal employment which entitles workers to a decent wage and to social security has decelerated, markedly during the 2000s (Bino 2013). Notwithstanding the formal-informal dichotomy existing in the manufacturing labour market in India, there are streams of views which argue for more flexibility in the Indian labour market (Besley and Burgess 2004). The core argument of this school is that firms should have a free hand in deciding the size of the workforce, being autonomous of institutionally determined rules. Against this backdrop, it would be interesting to see what the data says on the question: Does labour get a sufficient wage to meet living expenses?
We examine the trend of three variables: nominal wage, consumer price index (CPI) for industrial workers, and real wage, using secondary data from sources like Annual Survey of Industries (ASI) and Labour Bureau. While the data on Nominal Wage and CPI, for the period 1998-2010, were obtained from ASI and Labour Bureau, respectively, to calculate real wage, we discounted nominal wage by a deflator, which is a ratio of current year CPI to base year CPI. Here, we take 2001 as the base year. We compare the trend growth rate of nominal wages of workers and supervisory and managerial staff in Indian manufacturing during 1999–2008. Moreover, we examine select cases of the minimum wage, seeing if the minimum wage contains a premium for skill. Finally, using the National Sample Survey 66th round unit level data, we have computed the lowest limit of daily wage rates for manufacturing industries in India, primarily to match entry level wages and minimum wages.
The paper is organised into five sections. Section 2 discusses the trend of real and nominal wage from 1999–2001 to 2010–11. Section 3 discusses disparity in the wage rate, and basic aspects of employment. Section 4 discusses wage-productivity relationship in Indian manufacturing, and Section 5 concludes the paper.
2. Growth of Nominal and Real Wage and Wage Disparity
As shown in Table 1, during 1999–2011, for the whole manufacturing sector covered by the ASI, while the number of workers grew at the rate of 4%, the total annual wage bill showed a growth rate of 10%. Further, the nominal wage rate, defined as annual wage rate per worker, grew at the rate of 6%.
Is this growth in the nominal wage real in terms of the wage rate’s capacity to absorb the rise in commodity prices at the retail level? To assess this question, we use the CPI deflator, defined as the ratio of CPI at current prices to CPI at base-year prices (2000–01) multiplied by 100, to discount the nominal wage to get the real wage. Quite important, the real annual wage rate does not show a statistically significant trend growth rate.
| Year | Number of Workers | Total Annual Wages to Workers in Indian Rupees (in 100,000s) | Wages Per Worker | Consumer Price Index Deflator | Real Annual Wages in Rs Per Annum |
|---|---|---|---|---|---|
| 1998-99 | 63,64,464 | 24,82,648 | 39,008 | 92.58 | 42,136 |
| 1999-2000 | 62,80,659 | 26,30,427 | 41,881 | 96.29 | 43,496 |
| 2000-01 | 61,35,238 | 27,67,074 | 45,101 | 100.00 | 45,101 |
| 2001-02 | 59,57,848 | 27,43,824 | 46,054 | 104.15 | 44,220 |
| 2002-03 | 61,61,493 | 29,68,905 | 48,185 | 108.30 | 44,493 |
| 2003-04 | 60,86,908 | 30,47,777 | 50,071 | 112.23 | 44,616 |
| 2004-05 | 65,99,298 | 33,63,505 | 50,968 | 117.03 | 43,551 |
| 2005-06 | 71,36,097 | 37,66,366 | 52,779 | 123.00 | 42,910 |
| 2006-07 | 78,80,536 | 44,29,135 | 56,203 | 131.00 | 42,903 |
| 2007-08 | 81,98,110 | 51,03,023 | 62,246 | 141.66 | 43,941 |
| 2008-09 | 87,76,745 | 59,77,184 | 68,103 | 157.00 | 43,377 |
| 2009-10 | 91,57,802 | 68,94,071 | 75,281 | 175.90 | 42,798 |
| 2010-11 | 99,07,347 | 85,64,839 | 86,449 | 191.50 | 45,143 |
| Trend growth rate*** | 4% | 10% | 6% | 6% | Not Significant |
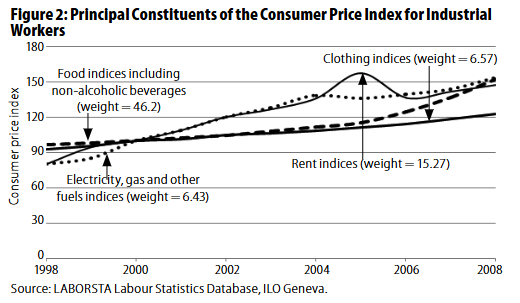
In fact, the trend of the CPI from 1998-99 to 2010-11 as given in Table 1 has not fully captured the severity of the recent spike in the cost of living of industrial workers in India, in particular food prices. Quite important, setting 2000 as a base, food and non-alcoholic beverages, electricity, gas and other fuels, clothing and rent account for 46.2%, 6.43%, 6.57% and 15.27% in the total basket, respectively. The above trends clearly indicate that the real wage rate in Indian manufacturing had not grown enough to capture the rise in food prices.
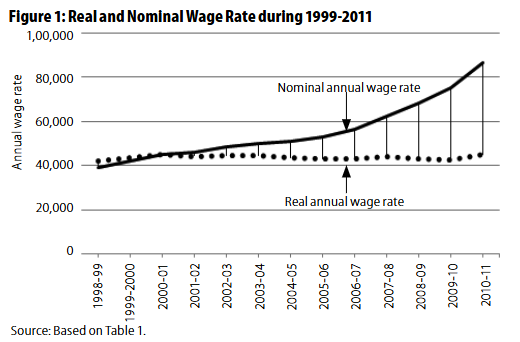
We plot the real and nominal wage rate (on vertical axis) and year (on horizontal axis). As shown in the figure, while the nominal wage rate reports an exponential growth, the real rate appears to be stagnant at Rs 45,000 per annum. Moreover, the gap between real and nominal wage rates had been discernibly widening during this period.
Disparity in Wages
Combining all industries, while supervisory and managerial staff report the highest annual daily nominal wage rate (Rs 818) in 2008-09, contract workers report the least (Rs 191), implying that wage rates for supervisory and managerial staff was 421% higher than that of contract workers. Interestingly, the wage premium earned by supervisory and managerial staff over contract workers is highest in the private sector (468%) while it is lowest in the public sector (327%).
In the public sector, the wage premium earned by supervisory and managerial staff over direct workers and contract workers were 88% and 328%, respectively, while in the same sector the wage premium earned by direct employees over contract workers was 165%. Quite important, in the public sector, the wage premium earned by directly employed workers over contract workers is 165%, higher than the premium earned by supervisory and managerial staff over directly employed workers (61%). Contrary to this pattern, in the private sector, the premium earned by supervisory and managerial staff over directly employed workers (380%) is much higher than the premium earned by directly employed workers over contract workers (18%).
This pattern may have its origin from the nature of corporate governance adopted by private and public sector firms. While the former applies market flexibility to the supervisory and managerial workforce, by incorporating performance of employees in the reward, the latter, though assessing employee performance through formal systems, are obliged to follow procedures outlined by the state to determine compensation for supervisory and managerial staff. More succinctly, the private sector in manufacturing, compared to its public sector counterpart, tends to give higher credence to performance to determine wages, while the public sector seems to give a much higher stake for demographic variables like seniority.
Quite clearly, as shown in Table 2, supervisory and managerial staff in the private sector, taken as a whole, earn a premium (60%) over their public sector counterpart. However, directly employed workers in the public sector earn a huge premium over directly employed workers in the private sector. Even after disaggregating the data in Table 2 for industries as well as regional units such as states (Appendices 2 and 3), we get a more or less similar pattern.
Quite important, the premium earned by directly employed workers over contract workers points to the consistent increase in the proportion of contract workers in Indian manufacturing, while the proportion of directly employed workers has been contracting, in particular, post-liberalisation (NCEUS 2007 and 2008; Roy 2007; Unni and Uma 2008; Bino et al 2009). Notwithstanding the alleged “rigidity” of labour laws in India, data point to the consistent progress in labour market flexibility that is built around the employment of low-wage contract workers (Birdikar 2011).
| Average Daily Earnings by Employees | Sector All India | Public Sector | Joint Sector | Private Sector |
|---|---|---|---|---|
| Directly employed workers | 205 | 356 | 280 | 192 |
| Contract workers | 157 | 134 | 101 | 162 |
| All workers | 191 | 306 | 232 | 183 |
| Supervisory and managerial | 818 | 575 | 496 | 922 |
| Other staff | 344 | 405 | 339 | 342 |
| All employees | 291 | 394 | 308 | 284 |
| Wage premium earned by directly employed worker over contract worker (in %)* | 31 | 165 | 176 | 18 |
| Wage premium earned by supervisory and managerial over directly employed workers (in %)** | 299 | 61 | 77 | 380 |
| Wage premium earned by supervisory and managerial over all workers (in %)*** | 328 | 88 | 114 | 403 |
| Wage premium earned by supervisory and managerial over contract workers (in %)**** | 421 | 328 | 390 | 469 |
| Public sector over private sector (directly employed workers) $ | – | – | – | 86 |
| Private sector over public sector (contract workers) $$ | – | – | – | 17 |
| Public sector over private sector (all workers) $$$ | – | – | – | 67 |
| Private sector over public sector (supervisory and managerial staff) $$$$ | – | – | – | 60 |
| Contract worker wage in private sector as a % of direct employee in public sector | – | – | – | 46 |
** ((Wage Rate of Supervisory and Managerial-Wage Rate of Directly Employed Workers) Divided by (Wage Rate of Directly Employed Workers)) times 100.
*** ((Wage Rate of Supervisory and Managerial-Wage Rate of All Workers) Divided by (Wage Rate of All Workers)) times 100.
**** ((Wage Rate of Supervisory and Managerial-Wage Rate of Contract Workers) Divided by (Wage Rate of Contract Workers)) times 100.
$ ((Wage Rate of Directly Employed Workers in Public Sector-Wage Rate of Directly Employed Workers in Private Sector) Divided by (Wage Rate of Directly Employed Workers in Private Sector)) times 100.
$$ ((Wage Rate of Contract Employed Workers in Private Sector-Wage Rate of Contract Workers in Public Sector) Divided by (Wage Rate of Contract Workers in Public Sector)) times 100.
$$$ ((Wage Rate of all Workers in Public Sector-Wage Rate of all Workers in Private Sector) Divided by (Wage Rate of all Workers in Private Sector)) times 100
$$$$ ((Wage Rate of Supervisory and Managerial Staff in Private Sector-Wage Rate of Supervisory and Managerial Staff in Public Sector) Divided by (Supervisory and Managerial Staff in Public Sector)) times 100.
Source: Annual Survey of Industries, 2008-09 Vol II
It would be interesting to see how the premiums earned by supervisory and managerial staff over workers – both directly employed and contract workers – are reflected in the growth of wage rates over a decade. To assess this question, we estimated the trend growth rates of nominal annual wage rates during the period 1998–2008 in respect of supervisory and managerial staff and workers. The wage rate for workers was derived from ASI data for different years. The series used for estimating the trend growth rate for supervisory and managerial staff was estimated by using workers per supervisory and managerial staff (see column 4 of table in Appendix 4) since we could not find a continuous time series for the number of supervisory and managerial staff from ASI reports for different years, while we got data on total wages paid to supervisory and managerial staff from ASI reports.
| NIC Code | Trend Growth Rate of Nominal Average Wage Rate of Supervisory and Managerial Staff (1999-2008) | Trend Growth Rate of Nominal Average Wage Rate of Workers (1999-2008) | Growth Rate Ratio |
|---|---|---|---|
| 14 | 13.2 | 6.7 | 1.97 |
| 15 | 7.3 | 4.8 | 1.521 |
| 16 | 15.4 | 4.2 | 3.667 |
| 17 | 14.8 | 3.1 | 4.774 |
| 18 | 11.7 | 7.5 | 1.56 |
| 19 | 5.7 | 5.1 | 1.118 |
| 20 | 12.6 | 6.2 | 2.032 |
| 21 | 7.7 | 2.7 | 2.852 |
| 22 | 12.2 | 4.7 | 2.596 |
| 23 | 8.3 | 4.7 | 1.766 |
| 24 | 12.5 | 3.9 | 3.205 |
| 25 | 8 | 5.1 | 1.569 |
| 26 | 10 | 3.3 | 3.03 |
| 27 | 9.5 | 4.4 | 2.159 |
| 28 | 11.3 | 4.2 | 2.69 |
| 29 | 15 | 4 | 3.75 |
| 30 | 11.8 | 5.3 | 2.226 |
| 31 | 10.9 | 2.5 | 4.36 |
| 32 | 13.4 | 5.9 | 2.271 |
| 33 | 16 | 4.5 | 3.556 |
| 34 | 10.7 | 3.3 | 3.242 |
| 35 | 9.6 | 6.4 | 1.5 |
| 36 | 13.1 | 6.4 | 2.047 |
Although the heuristics of deriving workers per supervisory and managerial staff to compute the nominal wage rate of supervisory and managerial staff does not guarantee the utmost precision, we do not deviate from the core objective of assessing the disparity between wage rates. Moreover, our method seems to be insulated against prospective exaggeration of disparity since the proportion of workers appears to have been varying within a thin margin across the manufacturing sector during 1993-94 – 2007-08 (Bino 2014).
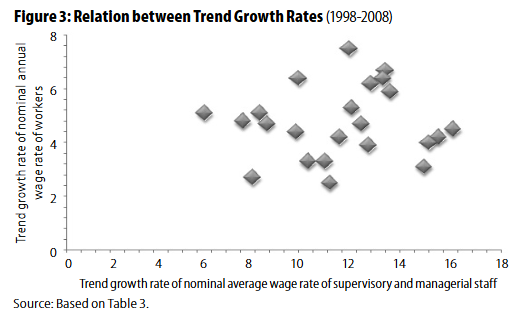
Table 3 portrays trend growth rates, showing that across industries without an exception, although varying in magnitude, trend growth rates for supervisory and managerial staff were perceptibly higher than those of workers. Interestingly, the trend growth of the annual nominal wage rate for supervisory and managerial staff divided by trend growth of the annual nominal wage rate for workers is in the range of 150% to 480%. Sincavage et al (2010) points to the widening gap between workers’ mean compensation and all employees’ mean compensation during 1999-2005. Moreover, as shown in Figure 3, there appears to be no discernible relation between both trend growth rates; presumably both the trend growth rates are statistically independent of each other, not showing significant covariation.
As argued by Ramaswamy (2008), the positive wage difference earned by managerial staff over worker presumably emanates from the higher skill endowment of the former category over the latter. Or, is the yawning gap between these wage rates embedded with the growing power of the capitalistic class, especially with the onset of liberalisation in India (Nair 2011). In recent times, central trade unions seem to have lost their importance in bargaining processes, while independent firm-specific unions have emerged to be game changers (Pratap 2012).
Quite important, drawing cues from the analysis of National Sample Survey 66th round, a whopping two-third of employment in manufacturing is informal in nature, devoid of any social security to the employed, while one-third of employment is formal. Moreover, 70% of non-managerial occupations are informal in nature while 64% of managerial occupations are formal in nature, forming a plausible explanatory base for the widening gap in compensation between managerial and non-managerial employment in manufacturing (Table 4). As given in parenthesis, managerial occupations form approximately one-tenth of total regular employment in manufacturing.
| Type of Occupation | Informal | Formal | Total |
|---|---|---|---|
| Non-managerial occupations (89%) | 70.30% | 29.70% | 100.00% |
| Managerial occupations (11%) | 36.40% | 63.60% | 100.00% |
| Total | 33.40% | 66.60% | 100.00% |
| Median age (years) | |||
| Non-managerial occupations | 29 | 35 | 31 |
| Managerial occupations | 37 | 30 | 34 |
| Median years of schooling | |||
| Non-managerial occupations | 7 | 10 | 7 |
| Managerial occupations | 12 | 15 | 15 |
| Median annual wage rate (rupees) | |||
| Non-managerial occupations | 44,200 | 78,000 | 52,000 |
| Managerial occupations | 74,880 | 2,34,000 | 1,82,000 |
| Persons with technical education (percentage) | |||
| Non-managerial occupations | 3 | 23 | 4 |
| Managerial occupations | 16 | 43 | 22 |
| Persons with formal vocational education (percentage) | |||
| Non-managerial occupations | 3 | 14 | 4 |
| Managerial occupations | 14 | 17 | 15 |
The median age for formal employment, for both types of occupations, is six-seven years higher than that of informal employment. Pooling formal and informal employment, the median age of managerial staff is 34 while the median age for non-managerial occupations is 31. It is important to note that the median year of schooling for managerial occupations is 15 years or tertiary education, while the median for non-managerial occupation is seven years, i e, upper primary schooling. Further, the median year of schooling is sensitive to the type of employment. Within the category of non-managerial occupations, formal employment reports 10 years as a median of schooling, while the median for informal employment is seven. Quite important, the wage in non-managerial occupations in informal employment is 43% less than that of non-managerial occupations in formal employment.
Quite apparently, there appears to be a discernible disparity between formal and informal workers in the attainment of vocational and technical education. Compared to formal employment, the informal segment reports an abysmal level of technical and vocation skill attainment. To be succinct, drawing cues from Table 4, skill formation appears to be a daunting challenge for the Indian manufacturing sector, entailing overhauling and innovative changes towards skill formation that provides not just higher levels of productivity but a consistent movement to decent and higher levels of wage rates. Quite clearly, there ought to be creative institutions, collaborations and policies which work towards inclusive skill formation, with a primary objective of linking skill, productivity and wage, in particular, for non-managerial occupations. The system needs to generate robust incentives for workers to acquire skills. However, Bino et al (2009) reports presenting the descriptive statistics from a sample survey of Indian industry – an appallingly lower count of on-the-job training sessions by manufacturing units, emphasising the lackadaisical approach by the Indian manufacturing sector towards human capital formation.
3. The Minimum Wage
The minimum wage is an important institution in the Indian labour market, enacted by the Minimum Wages Act 1948. According to this Act, workers in scheduled employments ought to be paid not less than the minimum wage. The institution of the minimum wage in India is entangled in overlapping governing, legal and enforcement systems. As shown in Table 5, there is a discernible variation in the number of scheduled employments and range of the minimum wage from state to state. Perhaps this complexity may have its roots in the way the legislative-executive-judiciary triumvirate evolved in different states in enacting and enforcing the minimum wage law. From the table, while for some states the range of minimum wages (difference between maximum and minimum) for workers is zero, there are states like Kerala and Andhra Pradesh reporting a perceptible range of wages.
From Table 5 it is clear that the daily minimum wages varies from Rs 46 per day in Tripura to Rs 247 per day in Delhi in 2011. At the maximum, the daily minimum wages vary from Rs 80 per day in Arunachal Pradesh to Rs 491.10 in Kerala. This variation can be partly explained by the variation in cost of living across states.
| Central Government/ SI No States/Union Territories | Number of Scheduled Employments in Which Minimum/ Wages Fixed/Revised | Range of Minimum Wages Per Day (Rs) | Maximum as a % of Minimum |
|---|---|---|---|
| 1 Andhra Pradesh | 71 | 69.27 – 280.52 | 405 |
| 2 Arunachal Pradesh | 30 | 80.00 – 80.00 | 100 |
| 3 Assam | 100 | 64.25 – 115.60 | 180 |
| 4 Bihar | 88 | 115.00 – 125.00 | 109 |
| 5 Chhattisgarh | 46 | 113.76 – 164.50 | 145 |
| 6 Goa | 21 | 150.00 – 150.00 | 100 |
| 7 Gujarat | 51 | 100.00 – 193.20 | 193 |
| 8 Haryana | 50 | 178.61 – 178.61 | 100 |
| 9 Himachal Pradesh | 12 | 120.00 – 120.00 | 100 |
| 10 Jammu and Kashmir | 28 | 110.00 – 110.00 | 100 |
| 11 Jharkhand | 88 | 138.23 – 138.23 | 100 |
| 12 Karnataka | 81 | 92.42 – 259.15 | 280 |
| 13 Kerala | 71 | 149.16 – 491.10 | 329 |
| 14 Madhya Pradesh | 36 | 124.00 – 175.00 | 141 |
| 15 Maharashtra | 67 | 81.35 – 251.29 | 309 |
| 16 Meghalaya | 27 | 100.00 – 100.00 | 100 |
| 17 Manipur | 15 | 122.10 – 122.10 | 100 |
| 18 Mizoram | 1 | 170.00 – 170.00 | 100 |
| 19 Nagaland | 37 | 100.00 – 100.00 | 100 |
| 20 Odisha | 84 | 92.50 – 92.50 | 100 |
| 21 Punjab | 60 | 154.40 – 160.48 | 104 |
| 22 Rajasthan | 62 | 135.00 – 166.46 | 123 |
| 23 Sikkim | 26 | 130.00 – 130.00 | 100 |
| 24 Tamil Nadu | 64 | 88.29 – 257.04 | 291 |
| 25 Tripura | 15 | 46.00 – 130.00 | 283 |
| 26 Uttarakhand | 58 | 101.20 – 207.50 | 205 |
| 27 Uttar Pradesh | 64 | 100.00 – 170.87 | 171 |
| 28 West Bengal | 55 | 117.00 – 196.00 | 168 |
| 29 Andaman and Nicobar Islands 6 | – | 205.00 – 271.15 | 132 |
| 30 Chandigarh | 48 | 234.30 – Not available | Not Available |
| 31 Dadra and Nagar Haveli 56 | – | 156.20 – 156.20 | 100 |
| 32 Daman and Diu | 72 | 156.20 – 156.20 | 100 |
| 33 Delhi | 29 | 247.00 – 247.00 | 100 |
| 34 Lakshadweep | 9 | 203.60 – 203.60 | 100 |
| 35 Pondicherry | 22 | 55.00 – 205.00 | 373 |
| 36 CLC(Central) | 45 | 136.50 – 256.00 | 188 |
| Highest | – | 247.00 – 491.10 | – |
| Lowest | – | 46.00 – 80.00 | – |
In India, across states, the minimum wage varies with skill level unskilled, semi-skilled and skilled. Table 6 depicts the minimum wage prescribed in different scheduled employments, for all three skill levels for Maharashtra in 2013. Quite important, across streams of scheduled employments, the premium earned by skilled over semi-skilled varies between 1.4% (printing press) and 9.8% (handloom), while the premium earned by semi-skilled over unskilled is in the range of 1.5% (printing press) to 10.8% (handloom). Both average skill premiums hover around 4%. However, there are industries like engineering that report abysmally low skill premiums, i e, 1.6% and 1.7%, triggering off a spiral of built-in disincentives for skill acquisition. Presumably, extremely low skill premiums tend to hamper human capital formation in manufacturing firms. Lackadaisical approaches to skill formation in the employment, mainly emanating from sources like the institution of minimum wage and industry.
| Industry | Skilled Wages Per Month Rs | Semi-Skilled Wages Per Month Rs | Unskilled Wages Per Month | Premium Earned by Skilled over Semi-Skilled in % | Premium Earned by Semi-Skilled over Unskilled in % | Premium Earned by Semi-Skilled over Unskilled in Rs Per Day |
|---|---|---|---|---|---|---|
| Cashew processing | 4,792 | 4,592 | 4,392 | 4.4 | 4.6 | 9 |
| Cement and cement-based | 4,334 | 4,256 | 4,178 | 1.8 | 1.9 | 4 |
| Chemical fertilisers | 7,591 | 7,091 | 6,591 | 7.1 | 7.6 | 23 |
| Cloth dyeing and printing | 7,194 | 6,694 | 6,394 | 7.5 | 4.7 | 14 |
| Cotton ginning and pressing | 7,206 | 6,706 | 6,206 | 7.5 | 8.1 | 23 |
| Drugs and pharmaceuticals | 5,750 | 5,650 | 5,550 | 1.8 | 1.8 | 5 |
| Dyes and chemicals | 7,142 | 6,842 | 6,542 | 4.4 | 4.6 | 14 |
| Eatable tobacco | 5,667 | 5,167 | 4,967 | 9.7 | 4 | 9 |
| Engineering | 6,170 | 6,070 | 5,970 | 1.6 | 1.7 | 5 |
| Glass industry | 6,020 | 5,920 | 5,820 | 1.7 | 1.7 | 5 |
| Handloom | 5,624 | 5,124 | 4,624 | 9.8 | 10.8 | 23 |
| Oil mill | 7,594 | 7,094 | 6,594 | 7 | 7.6 | 23 |
| Paints and varnishes | 6,380 | 6,280 | 6,180 | 1.6 | 1.6 | 5 |
| Paper and paper board | 7,779 | 7,279 | 6,779 | 6.9 | 7.4 | 23 |
| Plastic | 7,201 | 6,701 | 6,201 | 7.5 | 8.1 | 23 |
| Printing press | 7,040 | 6,940 | 6,840 | 1.4 | 1.5 | 5 |
| Soaps and cosmetics | 6,180 | 6,080 | 5,980 | 1.6 | 1.7 | 5 |
| Steel furniture | 6,280 | 6,180 | 6,080 | 1.6 | 1.6 | 5 |
| Tanneries and leather | 5,840 | 5,740 | 5,640 | 1.7 | 1.8 | 5 |
| Occupation | Trend Growth Rate of Minimum Wage during 2001-13 |
|---|---|
| Semi-skilled (automobile) | 9.8 |
| Unskilled (automobile) | 10.6 |
| Semi-skilled (construction) | 8.3 |
| Unskilled (construction) | 9.5 |
| Semi-skilled (electronics) | 9.0 |
| Unskilled (electronics) | 9.5 |
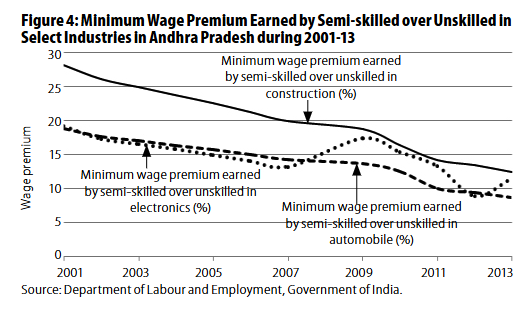
Similar trends appear to prevail in states like Andhra Pradesh. Although the minimum wage for semi-skilled and unskilled in three select industries in Andhra Pradesh – automobile, construction and electronic – grew at 8% to 11% during 2001-13 (Table 7), minimum wage premiums earned by semi-skilled over unskilled show a steady decline during this period (Figure 4).
Drawing cues from Figure 4 and Table 7, a perceptibly lower skill premium appears to be the prevailing norm in manufacturing industry located in major Indian states such as Andhra Pradesh and Maharashtra. Quite important, the skill premium has been declining continuously over the last 13 years.
Moreover, state and industry in India appear to be not very effective in enforcing the minimum wage, in particular, in manufacturing. As depicted in Table 8, across industries, the lowest daily wage varies between Rs 29 and Rs 107, showing a marked deficit from minimum wages declared for scheduled employment. This clearly calls for appropriate reforms in minimum wage formulation and implementation, primarily on two aspects.
| Industry (National Industrial Classification 2 Digit) | Lowest Daily Wage |
|---|---|
| Manufacture of food products and beverages | 29 |
| Manufacture of tobacco products | 107 |
| Manufacture of textiles | 30 |
| Manufacture of wearing apparel; dressing and dyeing of fur | 79 |
| Tanning and dressing of leather; manufacture of luggage | 43 |
| Manufacture of wood and of products of wood and cork | 29 |
| Manufacture of paper and paper products | 29 |
| Publishing, printing and reproduction of recorded media | 57 |
| Manufacture of coke, refined petroleum products and nuclear fuel | 100 |
| Manufacture of chemicals and chemical products | 19 |
| Manufacture of rubber and plastic products | 32 |
| Manufacture of other non-metallic mineral products | 80 |
| Manufacture of basic metals | 57 |
| Manufacture of fabricated metal products, except machinery and equipments | 86 |
| Manufacture of office, accounting and computing machinery | 79 |
| Manufacture of electrical machinery and apparatus | 100 |
| Manufacture of radio, television and communication equipment and apparatus | 67 |
| Manufacture of medical, precision and optical instruments, watches and clocks | 107 |
| Manufacture of motor vehicles, trailers and semi-trailers | 100 |
| Manufacture of other transport equipment | 57 |
| Manufacture of furniture; manufacturing | 100 |
First, skill premium in minimum wage is abyssmally low, generating implicit disincentives for workers to acquire skills. Second, the lowest wage across industries, a good proxy for the entry level wage in the labour market, is visibly much lower than the minimum wages for scheduled employment, conveying that both enforcement and implementing agencies need to ensure that the entry wage should not be lower than the minimum wage that has built in incentives for skill acquisition. Further, minimum wage rates in India are discernibly lower than rates prevailing in manufacturing hubs like China.
4. Wage-Productivity Relationship in Indian Manufacturing
It would be interesting to examine the magnitude of the relation between productivity and wage in Indian manufacturing. Drawing cues from the microeconomic theory of wage determination, in scenarios wherein both labour and product markets are perfectly competitive, we specify the real wage rate as a function of average productivity. While real wage rate is defined as nominal wage per worker divided the CPI deflator, average productivity refers to value of output discounted by manufacturing price deflators per worker; both valued at 2001-02 prices. To estimate the magnitude of relation we use a regression model, setting logarithm of real wage rate as a dependent variable and logarithm of productivity as an independent variable. Interestingly, we pool data of 57 industries, as classified by National Industrial Classification (NIC) 2004, during 1993-94 to 2007-08. This forms a panel of 845 data units. Although relation between the variables as shown in the figure hovers around direct trajectories, the magnitude of the relation appears to vary across industries.
Hajra (1963), Johri and Agarwal (1966), Dadi (1970), Verma (1972), Sen (1985), and Banga (2005) establish a positive relation between the wage rate and productivity. Further, Bhattacharya et al (2011), reversing the postulate of wage being determined by productivity, and treating labour productivity as an endogenous variable and real wage as an exogenous one, shows positive relation between real wages and labour productivity.
It is doubtful if an ordinary regression model, by pooling data across industries and time, without absorbing heterogeneities like identity of industries, provides a valid estimate. An alternative would be to allow the regression to be sensitive to the identity of the industry, called fixed effect panel regression (Greene 2012). Another variant of panel methodology is to combine noises with a constant, called random effect model. Quite important, our panel model, whether fixed or random effect, is a bivariate one, leaving aside prospective explanatory variables like capital-labour ratio, profit as a proportion of value added, and so on. Curious to know if adding these variables enriched the explanation, we did some estimation exercises. However, we did not see any perceptible changes in the magnitude of the relation between wage and productivity. This motivates us to retain a simple model to estimate the wage-productivity relation (Table 9).
Moreover, we compare fixed effect and random effect panel estimation with dynamic panel estimation using Arellano-Bover/Blundell-Bond approach wherein we treat lagged values of real wage rate as explanatory variables. Between fixed and random effect specification, using Hausman test, we choose the fixed effect model since the null hypothesis that the difference in coefficients is not systematic is rejected. The magnitude of the relation between the real wage rate and productivity is conveyed by the coefficient that measures the proportionate change in real value of output per worker divided by proportionate change in real wage per worker.
| Dependent Variable Logarithm of Real Wage Per Worker | Fixed Effect Model (N-845, 57 Industries, 1993-94 to 2007-08, Unbalanced Panel) | Random Effect Model (N-845, 57 Industries, 1993-94 to 2007-08 Unbalanced Panel) | Dynamic Panel Model (Arellano-Bover/Blundell-Bond Estimation with no Constant) N-751, 57 Industries, 1993-94 to 2007-08 Unbalanced Panel |
|---|---|---|---|
| Coefficient Standard Error |
Coefficient Standard Error |
Coefficient Standard Error |
|
| Logarithm of real value of output per worker | 0.12 (0.03) | 0.14 (0.03) | 0.12 (0.03) |
| Logarithm real wage per worker | – | – | 0.45 (0.07) |
| Logarithm real wage per worker +2 | – | – | 0.18 (0.00) |
| Constant | -0.42 (0.00) | -0.38 (0.00) | No constant |
Source: Estimated from data extracted from Annual Survey Industries (ASI) 1973-74-2003-04, EPW Research Foundation Compact Disc and ASI reports.
The value of the coefficient is 0.12 which is called elasticity of wage rate to productivity. This value means if productivity increases by Rs 100, real wages will increase by Rs 12. Moreover, a dynamic panel model also generates the same value. The estimate clearly shows a weak productivity-real wage linkage in Indian manufacturing. Presumably, firms need to devise a compensation system for manufacturing workers that captures not just the increase in cost of living but assuring strong productivity-wage linkages.
This also leads to another question, if industrial productivity has gone up over the years, due to modernisation and automation, as it is widely believed, how come the improved productivity is not being passed on to labour? Interestingly, as evinced by Bhandari and Heshmati (2006), lower wages, particularly for contract workers, stem from cost cutting drives, rather than being explained by productivity. Again, the poor correlation between wages and productivity as established above, leads to the belief that management, which determines wages, is unlikely to increase wages voluntarily. Since collective bargaining has declined following the failure of the textile strike era of the 1980s, legislation and proactive tripartite industrial relations need to work on living wage, fair wage and minimum wage.
5 Conclusions
Drawing cues from the data and patterns discussed above, we posit that manufacturing in India appears to have settled for an equilibrium of sharing the wage fund between workers and managerial staff in such a way that the first category has been getting wages that grow at rates being crowed out by the growing cost of living while managerial staff has been paid perceptible premiums. Moreover a lackadaisical minimum wage institution prevalent in India, primarily emanating from failures in enactment and enforcement, and the weakening of the labour-union movement, taken together, seem to have fostered the equilibrium of low wage wherein entry wages tend to be far lower than the already low minimum wages. In addition, the minimum wages preclude the desirable linkage between skill and compensation.
Quite pertinently, any progressive departure from the low wage equilibrium entails a constructive step to reform the institution of minimum wages in Indian manufacturing. Combining patterns given in Table 3, the median growth rates in nominal wage rates during 1999-2008 for workers and managerial staff hovered around 5% and 10% respectively. It would be interesting if we posit that the wage rate for workers too grows at 10%. At this hypothetical rate the annual wage rate for workers would grow from Rs 45,101 in 2000-01 (Table 1) to Rs 1,16,980 in 2010-11, substituting the prevalent annual wage rate of Rs 86,449, implying that minimum wages should not be lesser than rupees Rs 10,000, which can grow at the rate of 10% for the next few years.